
About this article
In this article, we cover Entity-Relationship diagrams (ERDs). We continue with our case study and use a charting tool to build an ERD from the entities, attributes, and relationships previously discovered.
In the process of building our ERD, we cover important concepts such as cardinality in database design, one-to-one relationships, one-to-many relationships, and many-to-many relationships. We also touch briefly on PostgreSQL data types.
This post is the third on a series exploring the subject of relational databases for the full-stack developer.
For quick access, here is the list of the articles on the topic:
- Introduction to Relational Databases
- Database Design: Entities, Attributes, and Relationships
- Database Design: Entity-Relationship Diagrams (this article)
- Database Design: Normalization
- Database Design: Entity-Relationship Diagram to Structured Query Language
- Deploying PostgreSQL for development and testing
- Structured Query Language Cheat Sheet
- Working with databases from Python
Introduction
In this post, you take the information about entities, attributes, and relationships from the previous article and create an Entity-Relationship diagram (ERD) using LucidChart.
LucidChart is an online diagramming tool. Using a tool for our ERD simplifies the creation process and makes keeping the diagram up-to-date trivial.
Once completed, LucidChart allows you to export the diagram as a series of Structured Query Language (SQL) statements, which you can use to implement the database in your favorite Relational Database Management System (RDBMS).
Before moving on, visit LucidChart and create a free account.
Create a new document
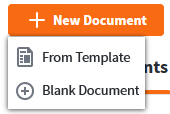
The LucidChart free account allows you to have up to three documents. To create a new document:
- Log in to LucidChart and click on
+ New Document>Blank Document
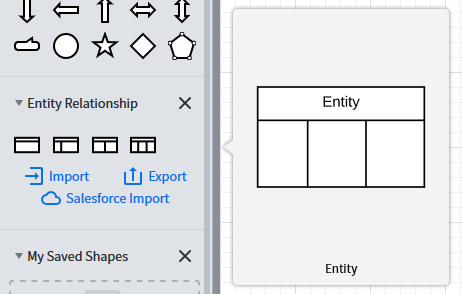
Once the new document opens, you want to add to your toolbox on the left, the shapes for Entity-Relationship Diagrams.
- Click on
Shapesin the top left

- Search for “entity relationship” and tick the checkbox next to
Entity Relationship
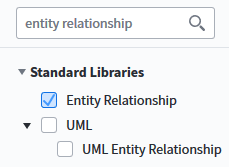
- Click on
Use Selected Shapesbutton in the lower right

5. The shapes for ER Diagrams show up on the toolbox.
Add entities and attributes
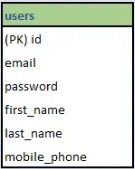
In the previous post, you identified 12 entities. Now is time to add them to your ERD. Start with the users entity, which has six attributes.
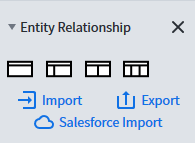
The process of adding entities to your ERD is simple:
- Drag the ER shape into the document. Use the one on the right that has three columns. With this shape, you can enter a key, a name, and a data type for each attribute.
- With the newly added entity selected, change the number of
fieldsfrom 3 to 6, and chooseSHADED HEADERandALTERNATE ROWS.
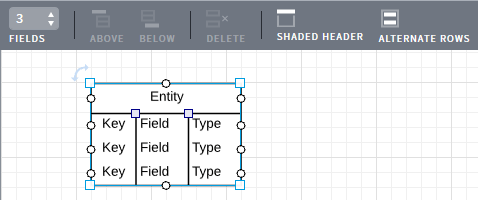
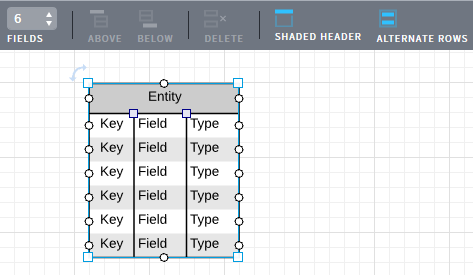
- Double-click on the “Entity” label and change it to “users”. Then use the
Tab keyto move to each attribute and change them as required. You can resize the entity as needed by dragging the squares in the corners.
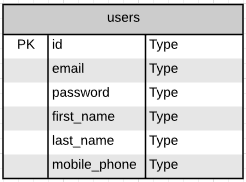
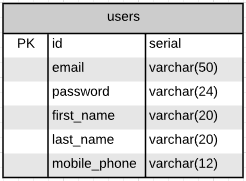
Users only have one key so far: a primary key for attribute id. The PK label in the first column represents this key. Notice that the third column (data types) remains unchanged. Let’s take care of that next.
Define the data types
As mentioned in the previous article, by the end of this series, you implement this database design in PostgreSQL. For this reason, when adding the data types for the attributes, you must use PostgreSQL data types.
In the case of users, you know that id is an autoincrementing integer. PostgreSQL has an integer type that you may use for id. However, it also has a serial type that the documentation describes as “autoincrementing four-byte integer.” The serial type is more appropriate for id than the integer type.
All other attributes for users are strings. PostgreSQL has a varchar data type that represents variable-length character strings. You may use this type and provide a maximum length inside brackets.
The resulting users entity with keys, attributes, and data type follows:
Pro Tip: Plain text passwords
You should NEVER store plain text passwords in a database. For now, we leave the users entity as it is, with a password attribute. In the last article in this series, you will deal with this and other security issues.
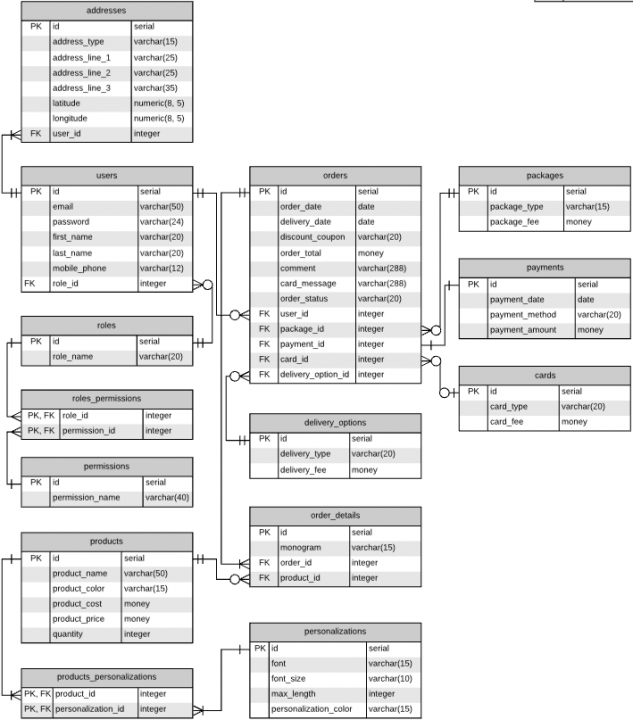
Adding data types to the rest of the entities, we get:
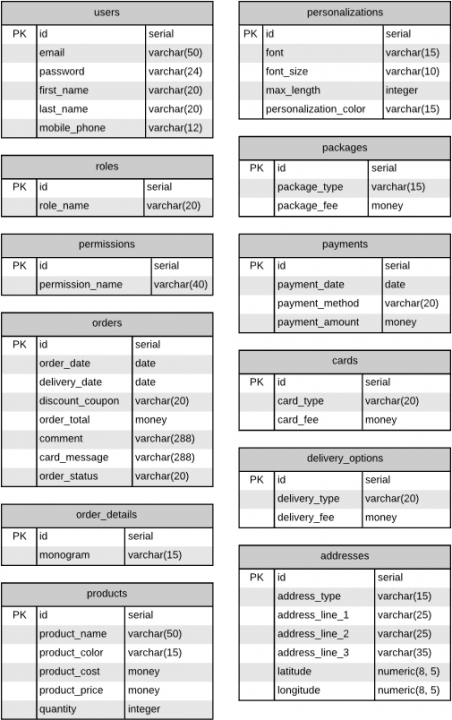
It is worth noting:
- Attributes like product_cost and product_price in products, and payment_amount in payments, which deal with currency, got the money data type.
- Attributes like order_date and delivery_date in orders, and payment_date in payments, got the date data type. In PostgreSQL, there is also a timestamp data type, which includes date and time. You may use it if you feel it is more appropriate for your use-case.
- Address latitude and longitude got the numeric data type. This type receives two numbers inside brackets: the precision (total number of digits) and the scale (total number of fractional digits). For example, numeric(8, 5) represents a number like 123.45678, which contains 8 digits, and 5 of those are fractional.
- The attribute product_color in products got the varchar(15) data type. A color, for instance, black, is a string, so at first glance, varchar seems correct. However, you don’t want users entering just any color name. Instead, products have specific color names like Chili Red, Hunter Green, and Blush, and, for consistency, only those should be used.
- Other attributes like payment_method in payments, font in personalizations, and card_type in cards, to name a few, present the same problem: users should select among a discrete number of choices. In the next article about database normalization, we deal with this issue.
Relationship cardinality
Before adding the relationships between entities, we should talk about cardinality, which defines the numerical attributes of the relationship between two entities. In other words, cardinality refers to how many are the minimum and the maximum number of instances of one entity that the other entity in the relationship can have?
In an ERD, you represent cardinalities by adding a symbol to the ends of the relationship lines between entities. Some common cardinalities and their symbols are:
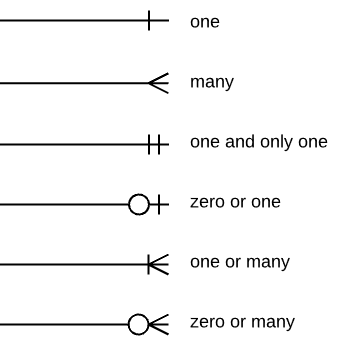
The concept is easier to grasp by going through an example. Using Excel, you can build a simple form to answer the cardinality questions:

In the previous article, you identified eleven relationships between entities in our case study. Taking, for instance, the relationship between users and orders, you stated: users place orders. To determine the cardinality, you should examine the relationship between these entities in both ways.
Filling the blue boxes in the form, you get the following questions

Placing the appropriate cardinality in the green box, you get the following answers:

Completing the exercise for all relationship in our case study, you get:

Adding relationships to the ERD
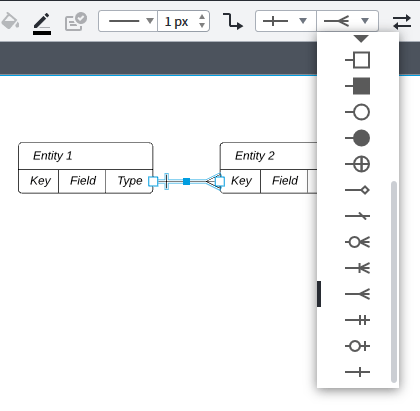
In LucidChart, you add relationships by connecting the circle next to attributes in the related entities.
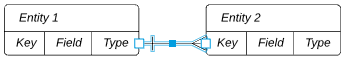
To change the cardinality symbols in the line endpoints, choose from the menu.
Let’s use our case study to review how to model some typical relationship types.
One-to-many relationships
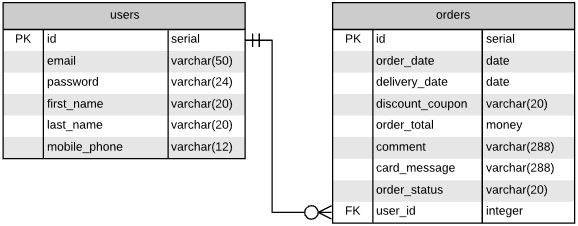
For one-to-many relationships, let’s look at users and orders and follow these steps:
- Determine which side is one and which side is many in the relationship.
- When we answered the cardinality questions above, we said that an order has one, and only one user and a user can have zero or many orders. In this case, the users entity is one, and the orders entity is many.
- Add a new attribute to the many-entity (orders). Name this attribute using the name of the one-entity (users) in singular plus _id. In this case, the new attribute would be user_id.
- The new attribute is a foreign key, so add FK to the key column next to the attribute.
- The new attribute is an integer, so add integer to the data type column.
- Finally, connect the id attribute in users to the user_id attribute in orders and adjust the cardinality symbols.
The resulting relationship follows:
Many-to-many relationships
For this kind of relationship, let’s look at roles and permissions.
From the answers to the cardinality questions, you know that roles can have one or many permissions, and permissions can have one or many roles.
To model many-to-many relationships, you need to add a new entity to your ERD known as an associative entity. The purpose of the new entity is to join both entities in a many-to-many relationship.
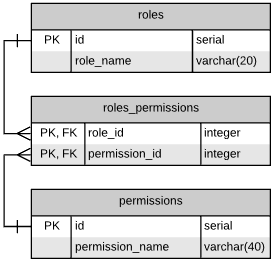
Let’s follow these steps to model the relationship between roles and permissions:
- Create a new entity and name it using the names of both entities in the relationship separated by an underscore. In this case, the name of the new entity would be roles_permissions.
- Add two attributes to the new entity. One is a foreign key related to the id of the roles entity, and the other is a foreign key related to the id of the permissions entity. These attributes are appropriately named role_id and permission_id.
- Since both attributes are foreign keys, add FK next to each of them.
- Since both attributes are integers, add integer for the data types.
- The new entity needs a primary key. In this case, both attributes compose the key (it is a composite key), so add PK next to each attribute.
- Connect the id of roles to role_id and the id of permissions to permission_id. Assign the cardinality symbols to the endpoints of both lines.
The resulting relationship follows:
One-to-one relationships
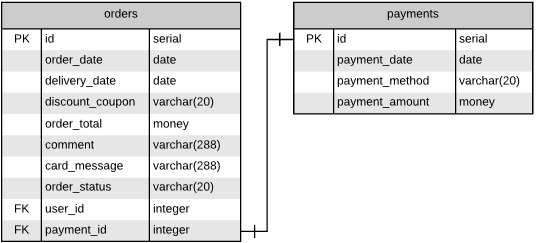
One-to-one relationships are not very common. In our case study, we have one: the relationship between orders and payments.
From the answers to the cardinality questions, you know that orders have one and only one payment, and payments have one and only one order.
If you remember from the entity analysis from the previous article, you debated if payments should be an attribute of orders or a separate entity. Either approach is valid. In this case, you decided to track payments as an entity since they refer to all financial transactions from the customers.
The result of separating payments from orders produces the one-to-one relationship.
To model it, we add the foreign key to the principal entity (in this case, orders) and connect the line between the id of payments and the foreign key of orders.
The naming, the key, and the data type assignment follow the same conventions used for one-to-many and many-to-many relationships.
The resulting relationship follows:
Completing the model for all the relationships in our case study, you get:
Conclusion
In this article, you used LucidChart to create an Entity-Relationship diagram for the database of an online store. You explored the topic of cardinality in databases and learned how to model one-to-many, many-to-many, and one-to-one relationships.
In the next article, you will dive deeper into the topic of database design by exploring database normalization.
References
- PostgreSQL data types
- An Overview Of PostgreSQL NUMERIC Type
- Database overview
- Entity-Relationship Diagrams part 1
- Entity-Relationship Diagrams part 2
- Associative entity
You may also like: